The official 2015 IVMOOC ended in April, but you may sign up for the self-paced version of the course. Already registered?

Forgot your password? Click here to reset it.

Overview

This course provides an overview about the state of the art in information visualization. It teaches the process of producing effective visualizations that take the needs of users into account.

The course can be taken for three Indiana University credits as part of the Online Data Science Program, as part of the Information and Library Science M.S. program, and as part of the online Data Science M.S. Program offered by the School of Informatics and Computing. Students seeking enrollment information should contact Rhonda Spencer at 812-855-2018, ilsmain@indiana.edu or datasci@indiana.edu.

Among other topics, the course covers:

  • Data analysis algorithms that enable extraction of patterns and trends in data
  • Major temporal, geospatial, topical, and network visualization techniques
  • Discussions of systems that drive research and development.
Just like in past years, students will have the opportunity to collaborate on real-world projects for a variety of clients. Click here to see the current list of clients and projects. You can also see the detailed results of the 2013 client projects from the Visual Insights book here.

Everyone who registers gains free access to the Scholarly Database (26 million paper, patent, and grant records), the Sci2 Tool (100+ algorithms and tools), and free PDF access to Part 2 of Katy Börner's Atlas of Knowledge (due out March 2015).

Please watch the introduction video to learn more.
Schedule

Pre-Questionnaire
January 13: Chapter 1 - Visualization Framework & Workflow Design
January 20: Chapter 2 - “When": Temporal Data
January 27: Chapter 3 - “Where": Geospatial Data
February 3: Chapter 4 - “What": Topical Data
February 10: Mid-term to be taken by February 16 at 5pm EST
February 10: Chapter 5 - “With Whom": Trees
February 17: Chapter 6 - "With Whom": Networks
February 24: Chapter 7 - Dynamic Visualizations & Deployment
March 3: Final exam to be taken by March 9 at 5pm EST
March 10 Choosing a Client
March 15-22: Spring Break – No New Materials
March 24: Presentation of Project Plans
March 31: Work on Projects
April 7: Submit Intermediate Project Results
April 14: Peer Feedback
April 21: Submit Final Project Results
April 28: Presentation of Projects
Post-Questionnaire
Instructors

Dr. Katy BornerKaty Börner
Instructor

Katy Börner is the Victor H. Yngve Professor of Information Science at the School of Informatics and Computing, Adjunct Professor at the School of Informatics and Computing, Adjunct Professor at the Department of Statistics in the College of Arts and Sciences at Indiana University where she directs the Cyberinfrastructure for Network Science Center. Her research focuses on the development of data analysis and visualization techniques for information access, understanding, and management. Watch her TEDx talk here.


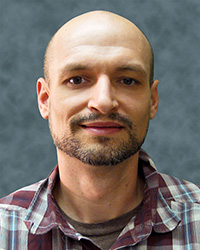
Michael Ginda Michael Ginda
Assistant Instructor

Michael Ginda is a data analyst and research assistant with the Cyberinfrastructure Center for Network Science. He holds a Master’s degree in Library Science from Indiana University. He research interests include knowledge representation and organization, metadata, and information networks.


Michael J. Stamper Michael J. Stamper
Teaching Assistant

Michael J. Stamper has a background in both fine arts and information science. As a Masters student, he studied human-computer interaction and information architecture at IU before switching his focus to interaction and design. Michael worked for two years as the Senior Designer at CNS before accepting a position at Minnesota State University-Moorhead as an Assistant Professor of Graphic Design. He is now back in Bloomington to focus on his design and academic career.


David Kloster David Kloster
Teaching Assistant

David Kloster is a graduate student working on his master’s degree in library science at Indiana University. His focus is on digital libraries and, more specifically, digital humanities. He is very interested in using visualizations to help humanists better disseminate their research and make it more accessible. He has participated in the IVMOOC previously, but mostly in a Q&A role and to give feedback from a humanities perspective.


Scott Emmons Scott Emmons
Student Liaison

Scott Emmons is a student at Bloomington High School North and research intern at the Cyberinfrastructure for Network Science Center. Scott plans to be a professor when he is older. His research interests lie at the intersection of business and computer science, and he is a co-founder of the business consulting firm Sparq Creative Solutions. To learn more about Scott and his work, visit scottemmons.com.

Suggested Readings

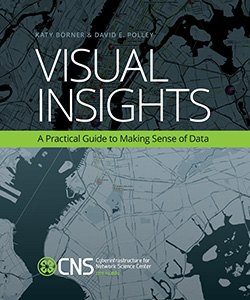
Visual Insights: A Practical Guide to Making Sense of Data was created as a companion textbook to the course. It offers a gentle introduction to the design of insightful visualizations, seamlessly blending theory and practice to give readers both the theoretical foundation and the practical skills to render data into insights. Each chapter has a hands-on section that demonstrates how plug-and-play macroscope tools can be used to run advanced data mining and visualization algorithms. The final two chapters present exemplary case studies and discuss future developments. Click here to learn more about the book and see a preview.
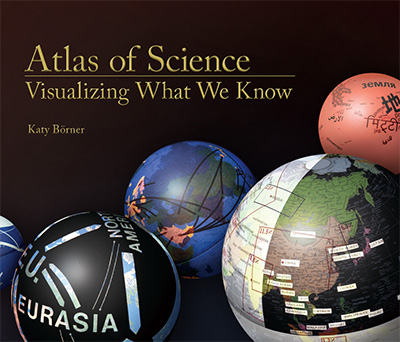
Atlas of Science by Katy Börner, based on the popular exhibit, "Places & Spaces: Mapping Science," describes and displays successful mapping techniques. The heart of the book is a visual feast: Claudius Ptolemy's Cosmographia World Map from 1482; a guide to a PhD thesis that resembles a subway map; "the structure of science" as revealed in a map of citation relationships in papers published in 2002; a visual periodic table; a history flow visualization of the Wikipedia article on abortion; a globe showing the worldwide distribution of patents; a forecast of earthquake risk; hands-on science maps for kids; and many more. Each entry includes the story behind the map and biographies of its makers.
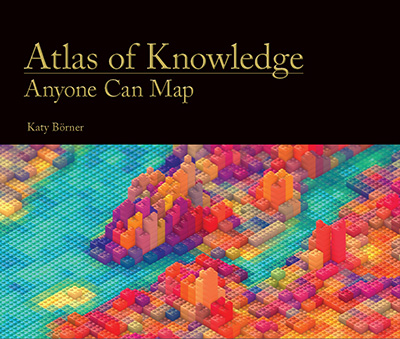
Drawing on 15 years of research and tool development, the Atlas of Knowledge introduces a theoretical visualization framework meant to empower anyone to systematically render data into insights. It aims to teach “timeless” knowledge that holds true over a lifetime while referring to an extensive set of references for “timely” advice on what tool and workflow is currently the best for answering a specific question. Specifically, the visualization framework uses a systems science approach to cover major types and levels of analysis; it identifies and explains different types of insight needs, data scales, visualizations, graphic symbols, and graphic variables; and it deeply integrates statistical, geospatial, topical, and network analysis and visualization.
Sci2 Tutorial by Scott Weingart, Ted Polley et al. The Science of Science (Sci2) Tool is a modular toolset specifically designed for the study of science. It supports the temporal, geospatial, topical, and network analysis and visualization of datasets at the micro (individual), meso (local), and macro (global) levels. Users of the tool can: access science datasets online or load their own; perform different types of analysis with the most effective algorithms available; use different visualizations to interactively explore and understand specific datasets; share datasets and algorithms across scientific boundaries.

Grading

Final grade is based on Class Participation (10%), Midterm (30%), Final Exam (30%), and Client Project (30%).

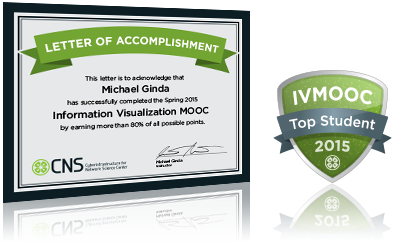
Participants that receive more than 80% of all available points will receive a personalized, green letter of accomplishment and digital badge (shown below). Those who do not participate in the project but earn more than 80% of all points on exams will receive an orange badge.
FAQ

Will I get actual credit for taking the course?
The course can be taken for three Indiana University credits as part of the Online Data Science Program just announced by the School of Informatics and Computing. Students seeking enrollment information should contact Rhonda Spencer at 812-855-2018 or datasci@indiana.edu.

How much does it cost to take the course?
The course is free, except for those taking the course for credit through Indiana University's Online Data Science Program (click here for details). All of the software and services required for the course are free. Throughout the entirety of this course we will use open-source software and/or freely available services to complete the work required to obtain a letter of accomplishment and badge.

See All FAQs »

Acknowledgments:
Course – Web Design: Samuel Mills, Development: Daniel Halsey, Robert P. Light, and Adam H. Simpson, Systems Administration: Mike T. Gallant. Teaser Film – Writing & Direction: Andreas Bueckle, Acting: Elizabeth Record, Elisa Repo, and Ashish Shendure, Camera Assistant: Malte Muehle, Production: Katy Börner, Co-Production: Samuel Mills. Support for the IVMOOC comes from CNS, CITL, ILS, SOIC, and the Trustees of Indiana University.